Update from Perspetivo's analysis platform
Perspetivo recently celebrated its two-year anniversary, and much has happened since its inception in 2022. Over the years, a long list of technical implementations has been carried out to make our customer portal as user-friendly and accessible as possible – regardless of previous statistical or digital expertise.
Our analysis manager, Ameer Abdulal, explains how.
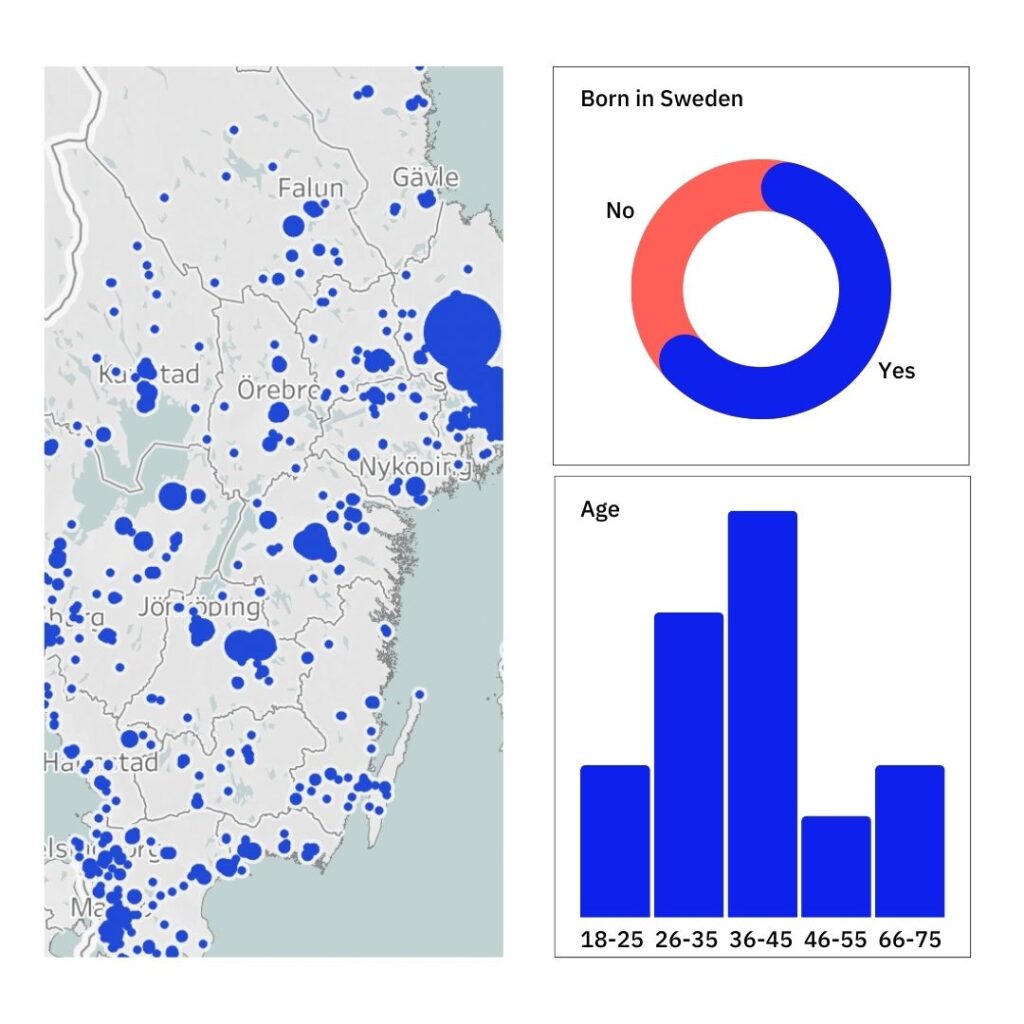
Perspetivo’s analysis platform now features an interactive dashboard, enabling customers to navigate their data seamlessly through personalized user accounts. With cross-tabulation and advanced filtering capabilities, users can uncover the narrative within their data and effortlessly derive insights tailored to the specific needs of their organization. This functionality empowers users to make data-driven decisions.
“Our digital customer portal enhances the accessibility and usability of data. It’s an innovative technical solution that makes it easier for our customers to understand and apply insights without prior statistical knowledge,” explains Ameer Abdulal, analysis manager and developer of the dashboard.
With just a few clicks, for example, you can get answers to questions like how many percent of foreign-born women aged 45-55 feel safe in a specific area, and directly compare with other target groups or other areas. The data can also be downloaded as a ready-made report.

Perspetivo’s vision is to contribute to a more inclusive society by ensuring that as many perspectives as possible are represented in research – providing organizations with representative data. This purpose is further strengthened by making the same data accessible for everyone to understand, manage, and utilize.
“Our platform serves as a catalyst for organizations to make reliable decisions, thanks to our representative and user-friendly data. Our product is by default inclusive,” describes Ameer.
Are you interested in having your own personalized dashbord? Read more about Dashboard as a Service by following the link below.